Magelang Rice Production on Rice prices
personalProject | Jan. 9, 2023, 11:40 p.m.
This is a self-study to train myself in the world of data analytics. Keep in mind that the method used here probably isn't the best one, therefore I'll try to make changes along the way toward my journey in learning data analytics. Besides, the data I collected probably is not accurate either, even tho I got it mostly from the Indonesian government site.
Gathering the data
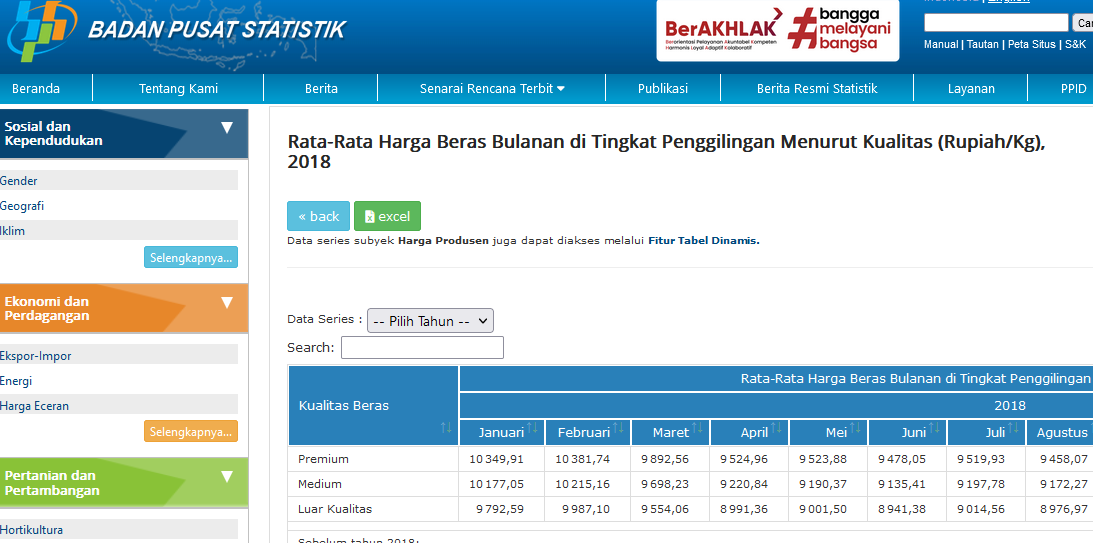
The first data I collected is called "Rata - rata harga beras bulanan di tingkat penggilingan berdasarkan kualitas" From Badan Pusat statistik (BPS) site.
The table consist of month, year, price by quality divided to premium, medium and luar kualitas.
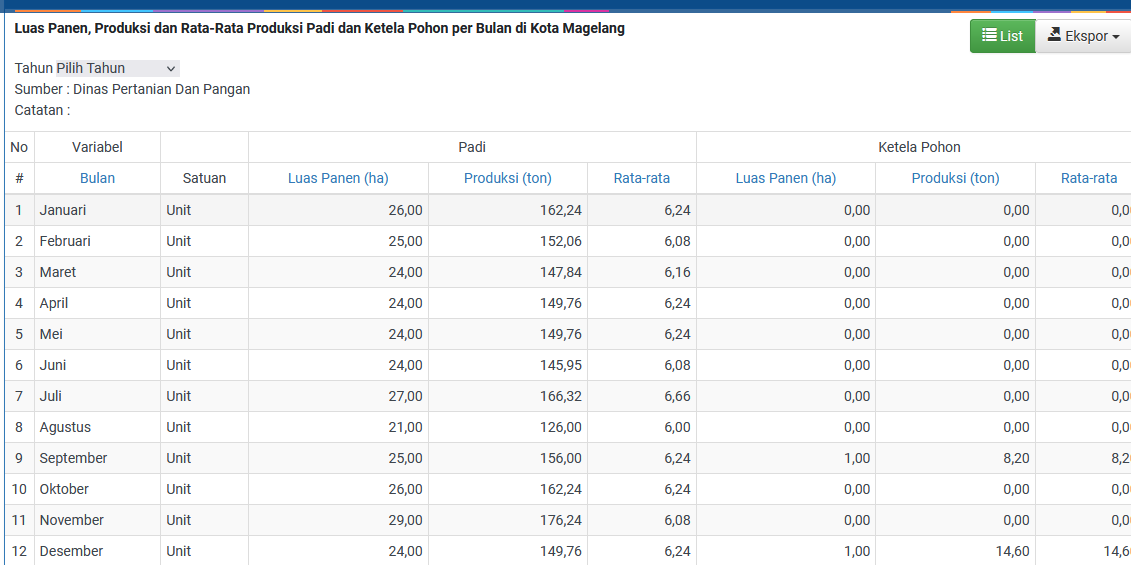
For the other data, I struggle to find national rice production data with a monthly report. So I decided to collect the data from Magelang regency called "Luas panen, produksi dan rata - rata produksi padi dan ketela pohon per bulan di kota Magelang" from Magelang regency satudata portal site.
Preprocessing
I started to remove some unnecessary columns such as the ketela pohon section and some nulls, make sure of consistency with formatting then start to merge it.
I created a new column for the mean of the three types of prices(premium, medium, luar kualitas) so that I can try to run the CORREL function with each of the price types.
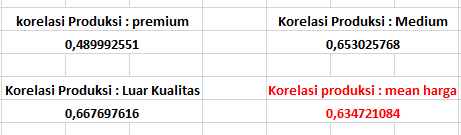
As the result above, we can see that luar kualitas has the highest correlation and premium with the lowest one.
Analyzing Data
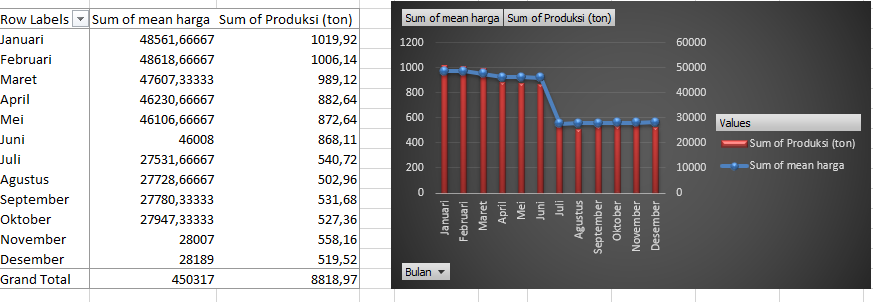
I create a Pivot table to help me analyze and create the visualization with production and each of the prices, then group it by month.


Summary
The correlation analysis between Magelang's monthly rice production and
rice prices revealed strong positive relationships across all grades of
rice, with the highest correlation coefficient of 0.667 for "luar
kualitas" and the lowest correlation coefficient of 0.489 for "premium".
However, the correlation indicates that when the production goes up, the prices also go high. Which is weird considering how principal economy worked with the law of supply and demand, it's important to note that correlation does not imply
causation and other factors may also be influencing the results.
Therefore, I'm planning to incorporate weather data, specifically rainfall data which can
help to gain a better understanding of the relationship between rice
prices and production, and to control for any potential confounding
effects. Validation of the results with domain experts and effective
communication of the findings can also help to ensure the accuracy and
meaningfulness of the results.