Central Java Dengue Cases in Relation to Population and Rainfall
personalProject | Aug. 5, 2024, 11:04 p.m.
Introduction
When I started this project, the idea came from a rather unsettling experience. A few people close to me had contracted dengue fever one after another, almost like a relay race, passing the baton of illness. It got me thinking about how common dengue is in Central Java and whether factors like population density and rainfall might be driving these outbreaks. This curiosity turned into a personal project that I hoped would not only satisfy my questions but also enrich my portfolio as I work towards becoming a data analyst.
The Struggle: Data Collection
The journey began with data collection, which turned out to be more challenging than I anticipated. My initial goal was to get a comprehensive dataset of monthly dengue cases across all regions in Central Java. However, finding complete data proved difficult. I could only track down monthly dengue case data for January to October of both 2022 and 2023 from Portal Data Jawa Tengah. The challenge didn’t stop there.
When it came to rainfall data, things got even more complicated. The Indonesian Meteorology, Climatology, and Geophysical Agency (BMKG) only allows the download of daily data, one month at a time, per weather station. This meant that collecting data for all of Central Java was unrealistic within a reasonable timeframe. So, I had to narrow my focus to the central weather station located in Semarang, which meant my analysis would be limited to the six closest regions according to BMKG map(wind blow & mountain): Kota Semarang, Kabupaten Semarang, Kendal, Temanggung, Demak, and Grobogan.
"These are the reason why I wanted to make the article about gathering data from Indonesia's governmental online platforms"
Preprocessing
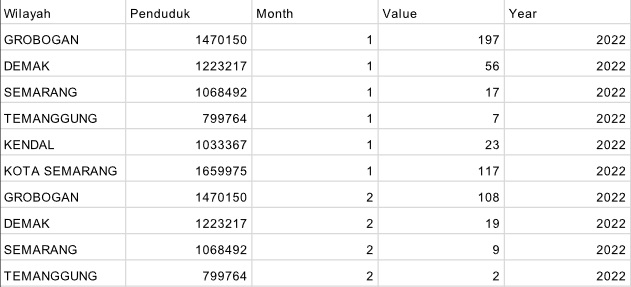
With the data finally in hand, the next step was preprocessing. For the dengue case data, first I needed to clean up the unwanted data such as kecamatan and kelurahan also matching the format between the 2022 & 2023 dataset, then trim down the dataset to only include the six regions I was focusing on. Now I can start combining the dataset with the same format, This also required transforming the data from a wide format to a long format using Excel to make it easier to analyze.
The rainfall data required even more work. Since the BMKG data had some gaps and all needed to be combined for all the month, there are multiple blank which are 8888 for not measurable data, 9999 for no record activity and the blank itself. I filled in the blanks using interpolation techniques. Then, I transformed the daily rainfall data into monthly data using Python(notebook link). This step was crucial because I wanted to see how the monthly rainfall patterns might correlate with the number of dengue cases each month.
Visualizing the Results
Finally, it was time to bring the data to life with visualizations. I used Tableau to create clear and informative charts that could tell the story at a glance. The visualizations helped highlight trends and correlations between dengue cases, population density, and rainfall across the selected regions in Central Java(tableau link).
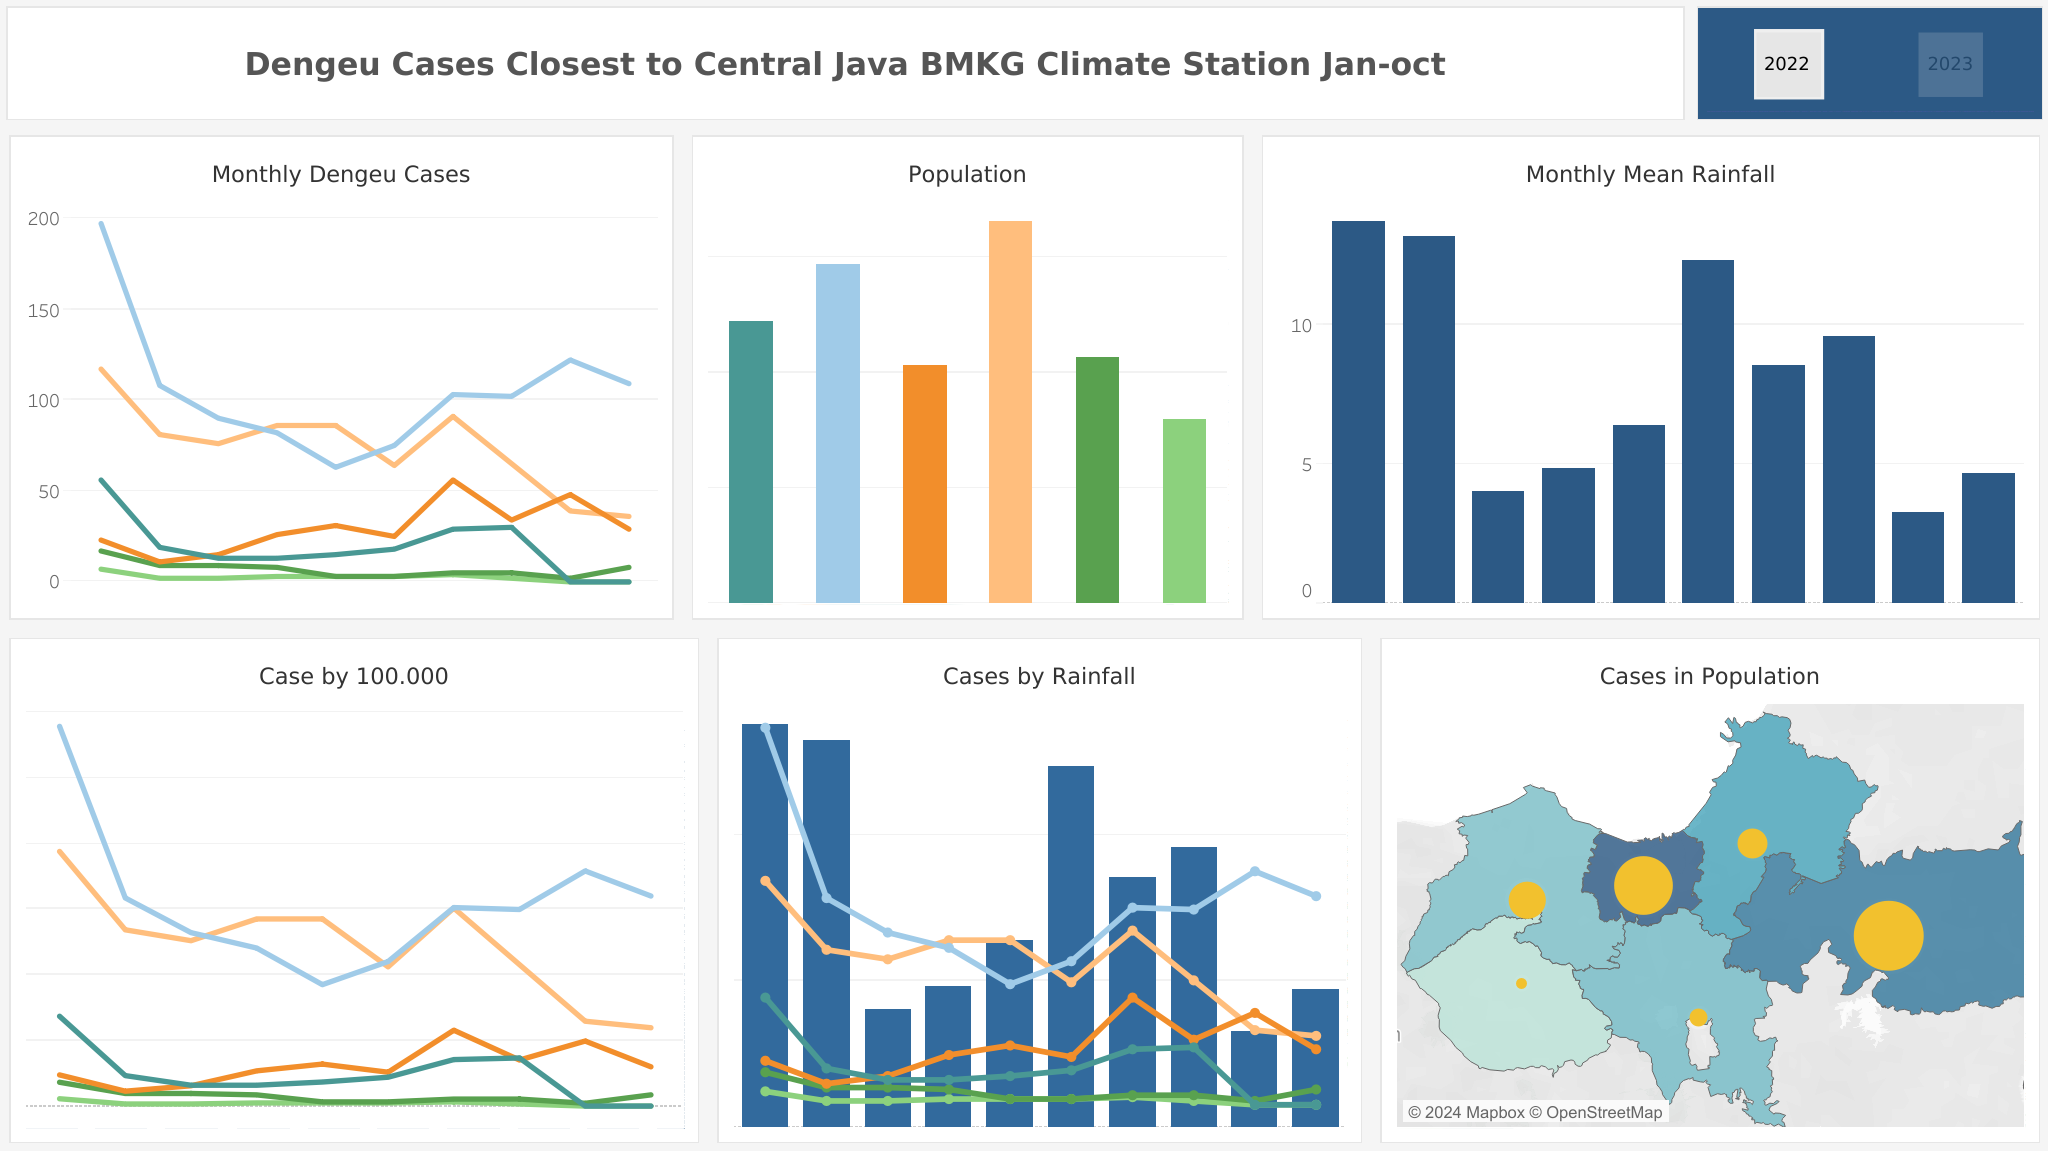
In the end, this project was not only a way to explore an important health issue in my region but also a chance to apply and showcase my data analysis skills. It was challenging at times, especially when it came to gathering and preparing the data, but the results were worth it. Now, I have a solid project to add to my portfolio that demonstrates my ability to tackle real-world data problems, from collection to visualization.